Collaborating with security, product, and UI/UX teams at Arctic Wolf, I led user research to address challenges faced by our in-house security analysts. Our goal was to enhance productivity and efficiency by creating a unified dashboard that streamlined workflows for Triage Security Engineers (TSEs) across different levels.
Arctic Wolf provides security monitoring systems to companies along with a team of Triage Security Engineers (TSE) that assesses security incidents. TSE’s go through a large number of incidents on a daily basis and raise concerning incidents that are detected by Arctic Wolf’s sensors. This task is also called triaging.
To fully take advantage of the opportunity to scale and grow its number of clients, it was imperative that the TSE’s had the agency and ability to fine control the scope of incidents that they analyzed.
Having direct access to TSE's at Arctic Wolf, I conducted comprehensive user experience research to make sure the new solution gave TSE's easy access to controls for high repetition actions and a dynamic view for incidents. Engineers are now able to quickly adapt to new contexts for investigations without disrupting their flow.
Arctic Wolf faced a critical issue: Level 2 and Level 3 TSEs, who handle complex security investigations, were constrained by a legacy dashboard with significant usability limitations. While Level 1 TSEs had a dedicated and optimized tool, higher-level TSEs struggled with inefficient workflows and high cognitive loads. We were tasked with designing a new solution that unified dashboards for all levels while addressing their specific needs and pain points.
![Dashboard and visualizations | Kibana Guide [8.2] | Elastic](https://cdn.prod.website-files.com/62204e20d0cb580ea5d17836/6285d07ebfb7b0bec342e1ea_dashboard_ecommerceRevenueDashboard_7.15.0.png)
We began with an extensive research phase to uncover the root problems and understand user needs:
Key Insights:


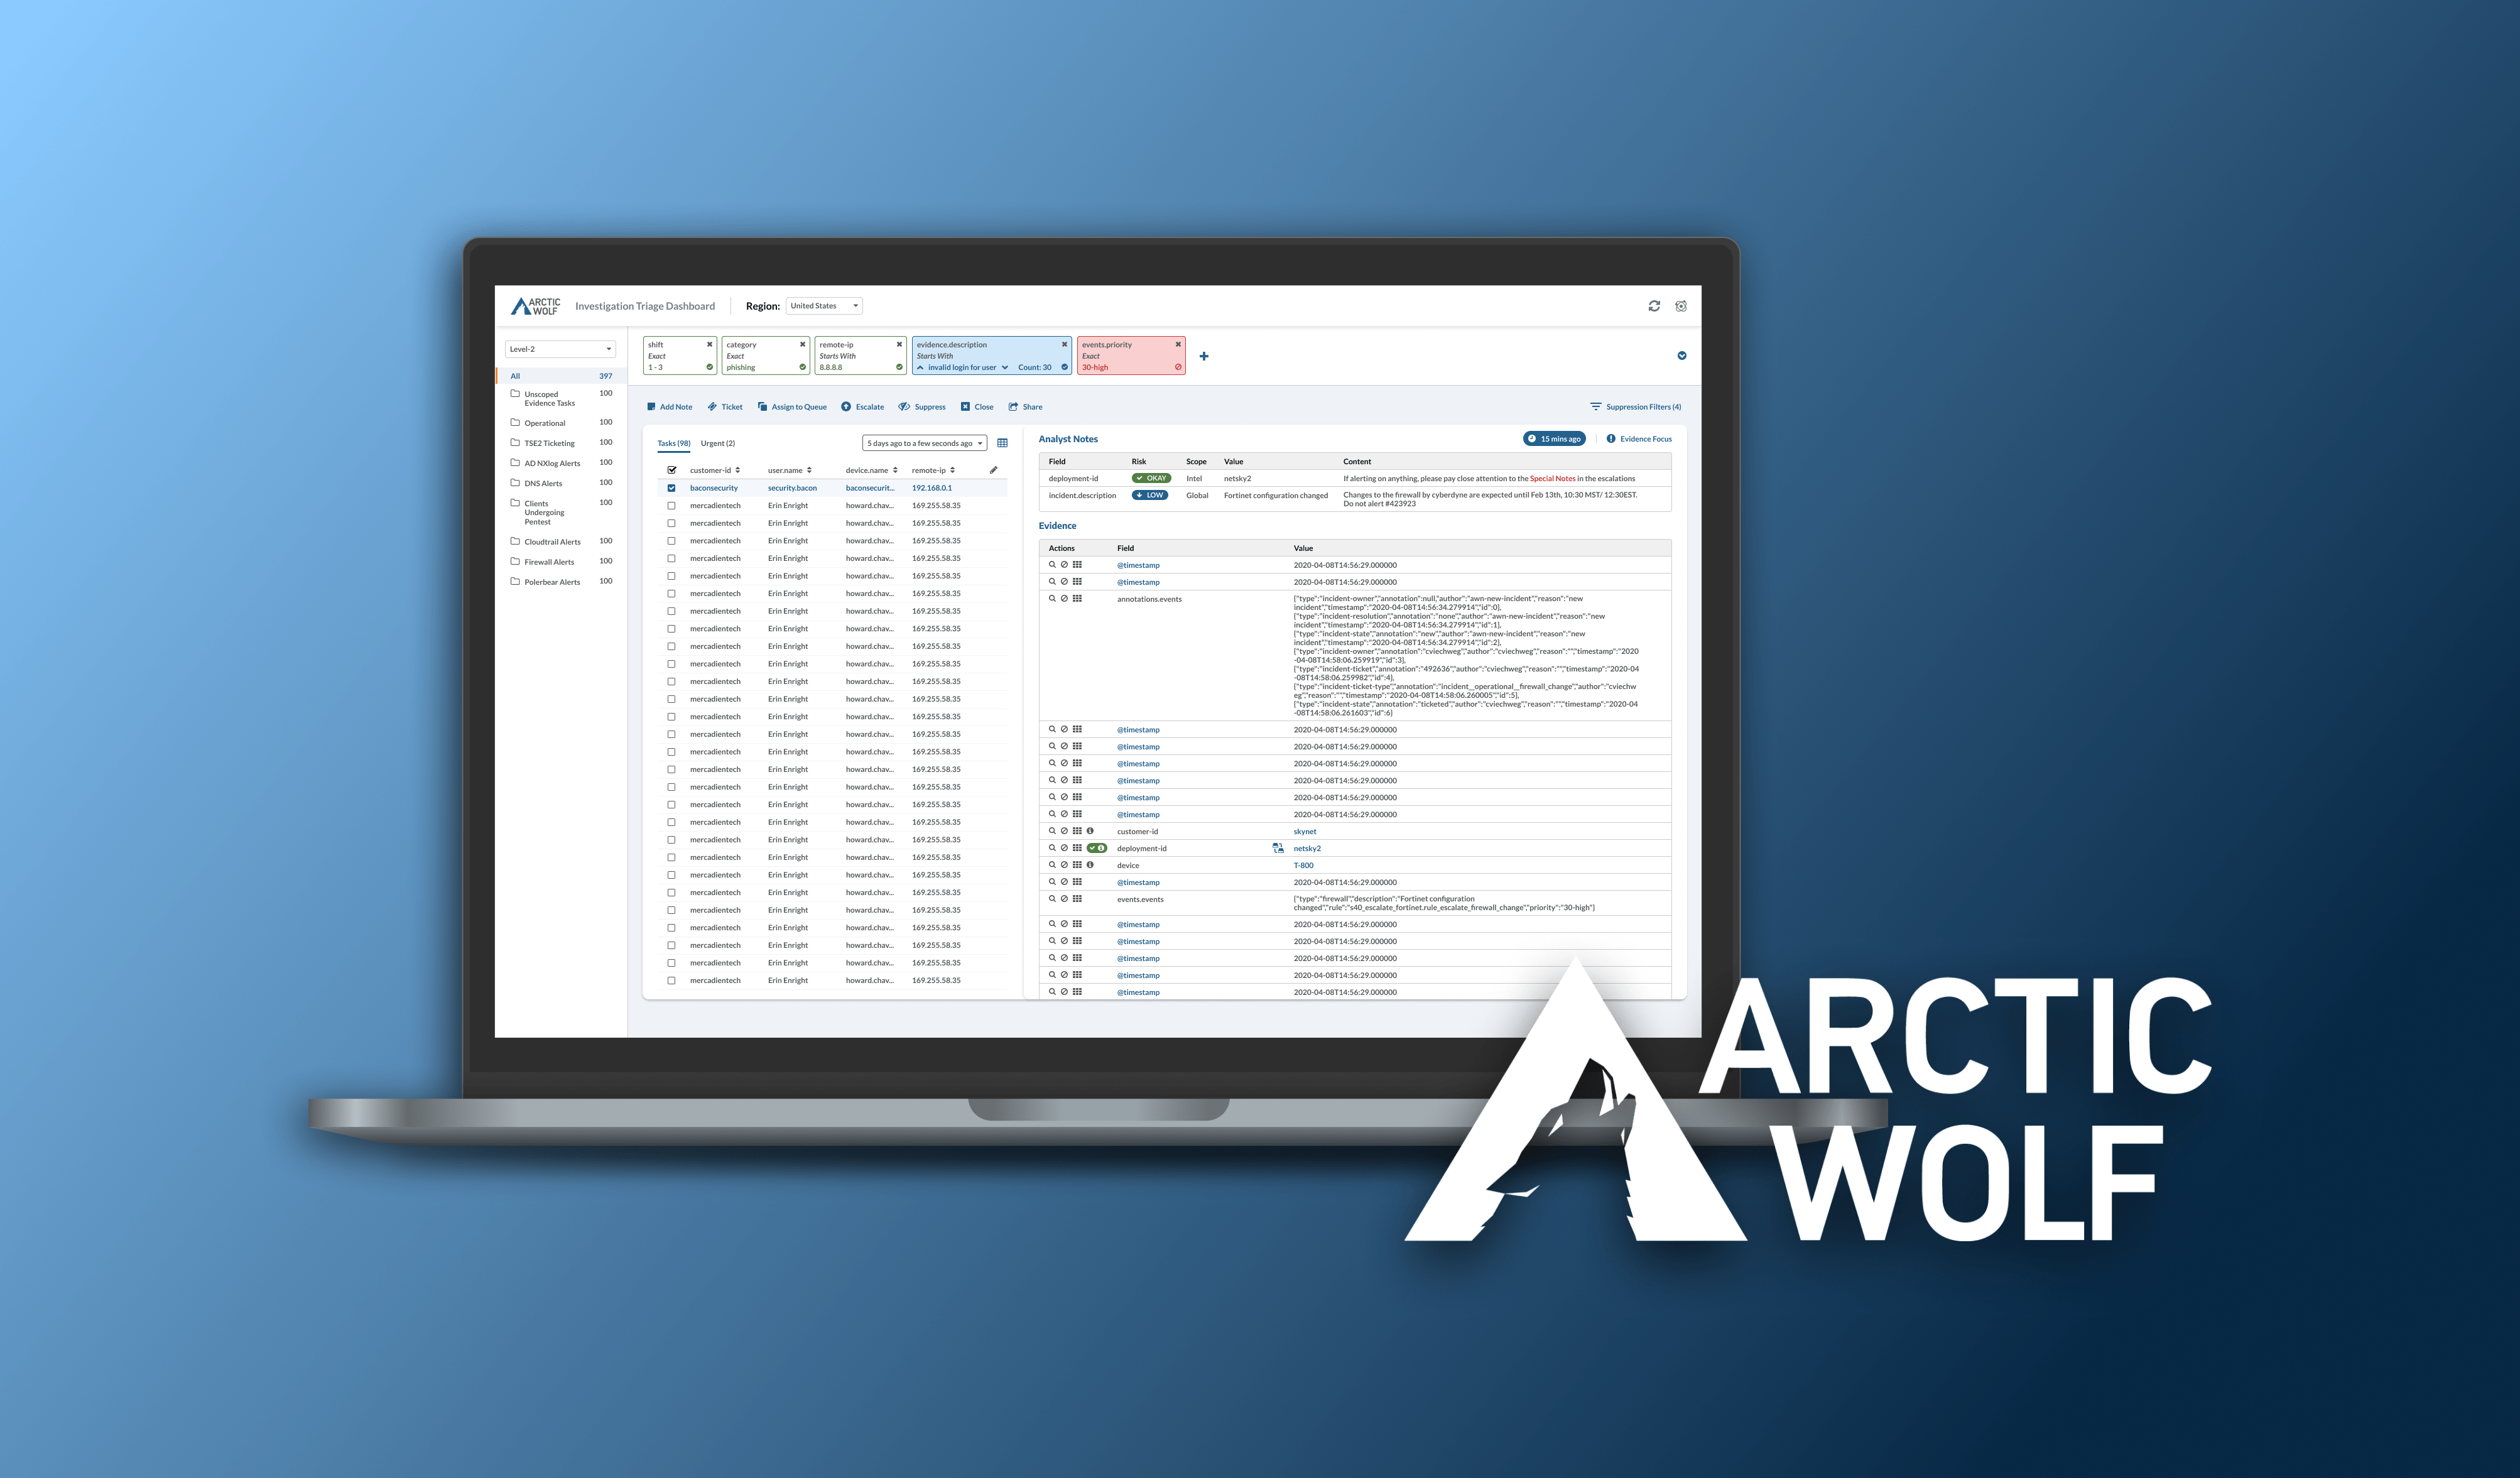
The resulting dashboard, "Triage UI," incorporated these features:

Key repetitive actions are available in a toolbar for quick access and can be actionable on multiple incidents with multi-select.
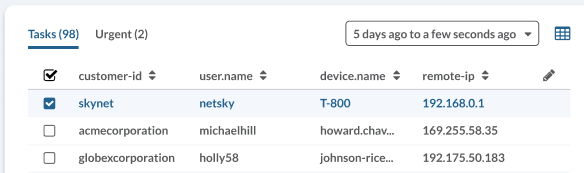
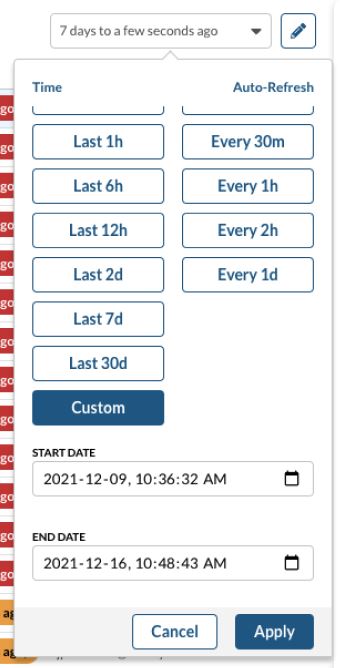
One of the filters that TSE’s can use to narrow the scope of incidents is time. The time frame controls are accessible right above the tabular list of incidents. The most commonly chosen time intervals are offered as quick selection buttons to reduce time.


To reduce the noise on the incident board, the Triage UI introduced suppression filters to automatically hide incidents with known false positive conditions. Unlike the existing dashboard, where these filters had to be reapplied after each reload, the Triage UI saves suppression filters to the user’s profile. This enhancement allows TSEs to resume their workflows immediately without the need to reconfigure settings, improving efficiency and reducing friction.
“Suppression is nice! It auto adds the filters that you want to suppress for. But adding filters and it's values are kind of annoying, we should be able to auto add properties that apply to that task.” - TSE Level 2
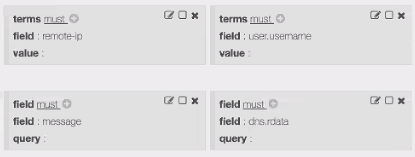
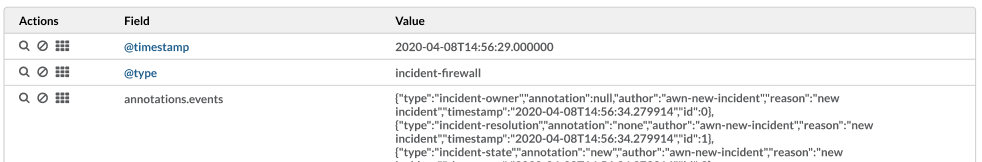
In the old dashboard, TSE’s needed to manually copy and paste field values to create suppression filters. In the Triage UI, once the TSE sees a field value of concern, they are able to automatically add that value as a filter through the filter controls available right next to the field.

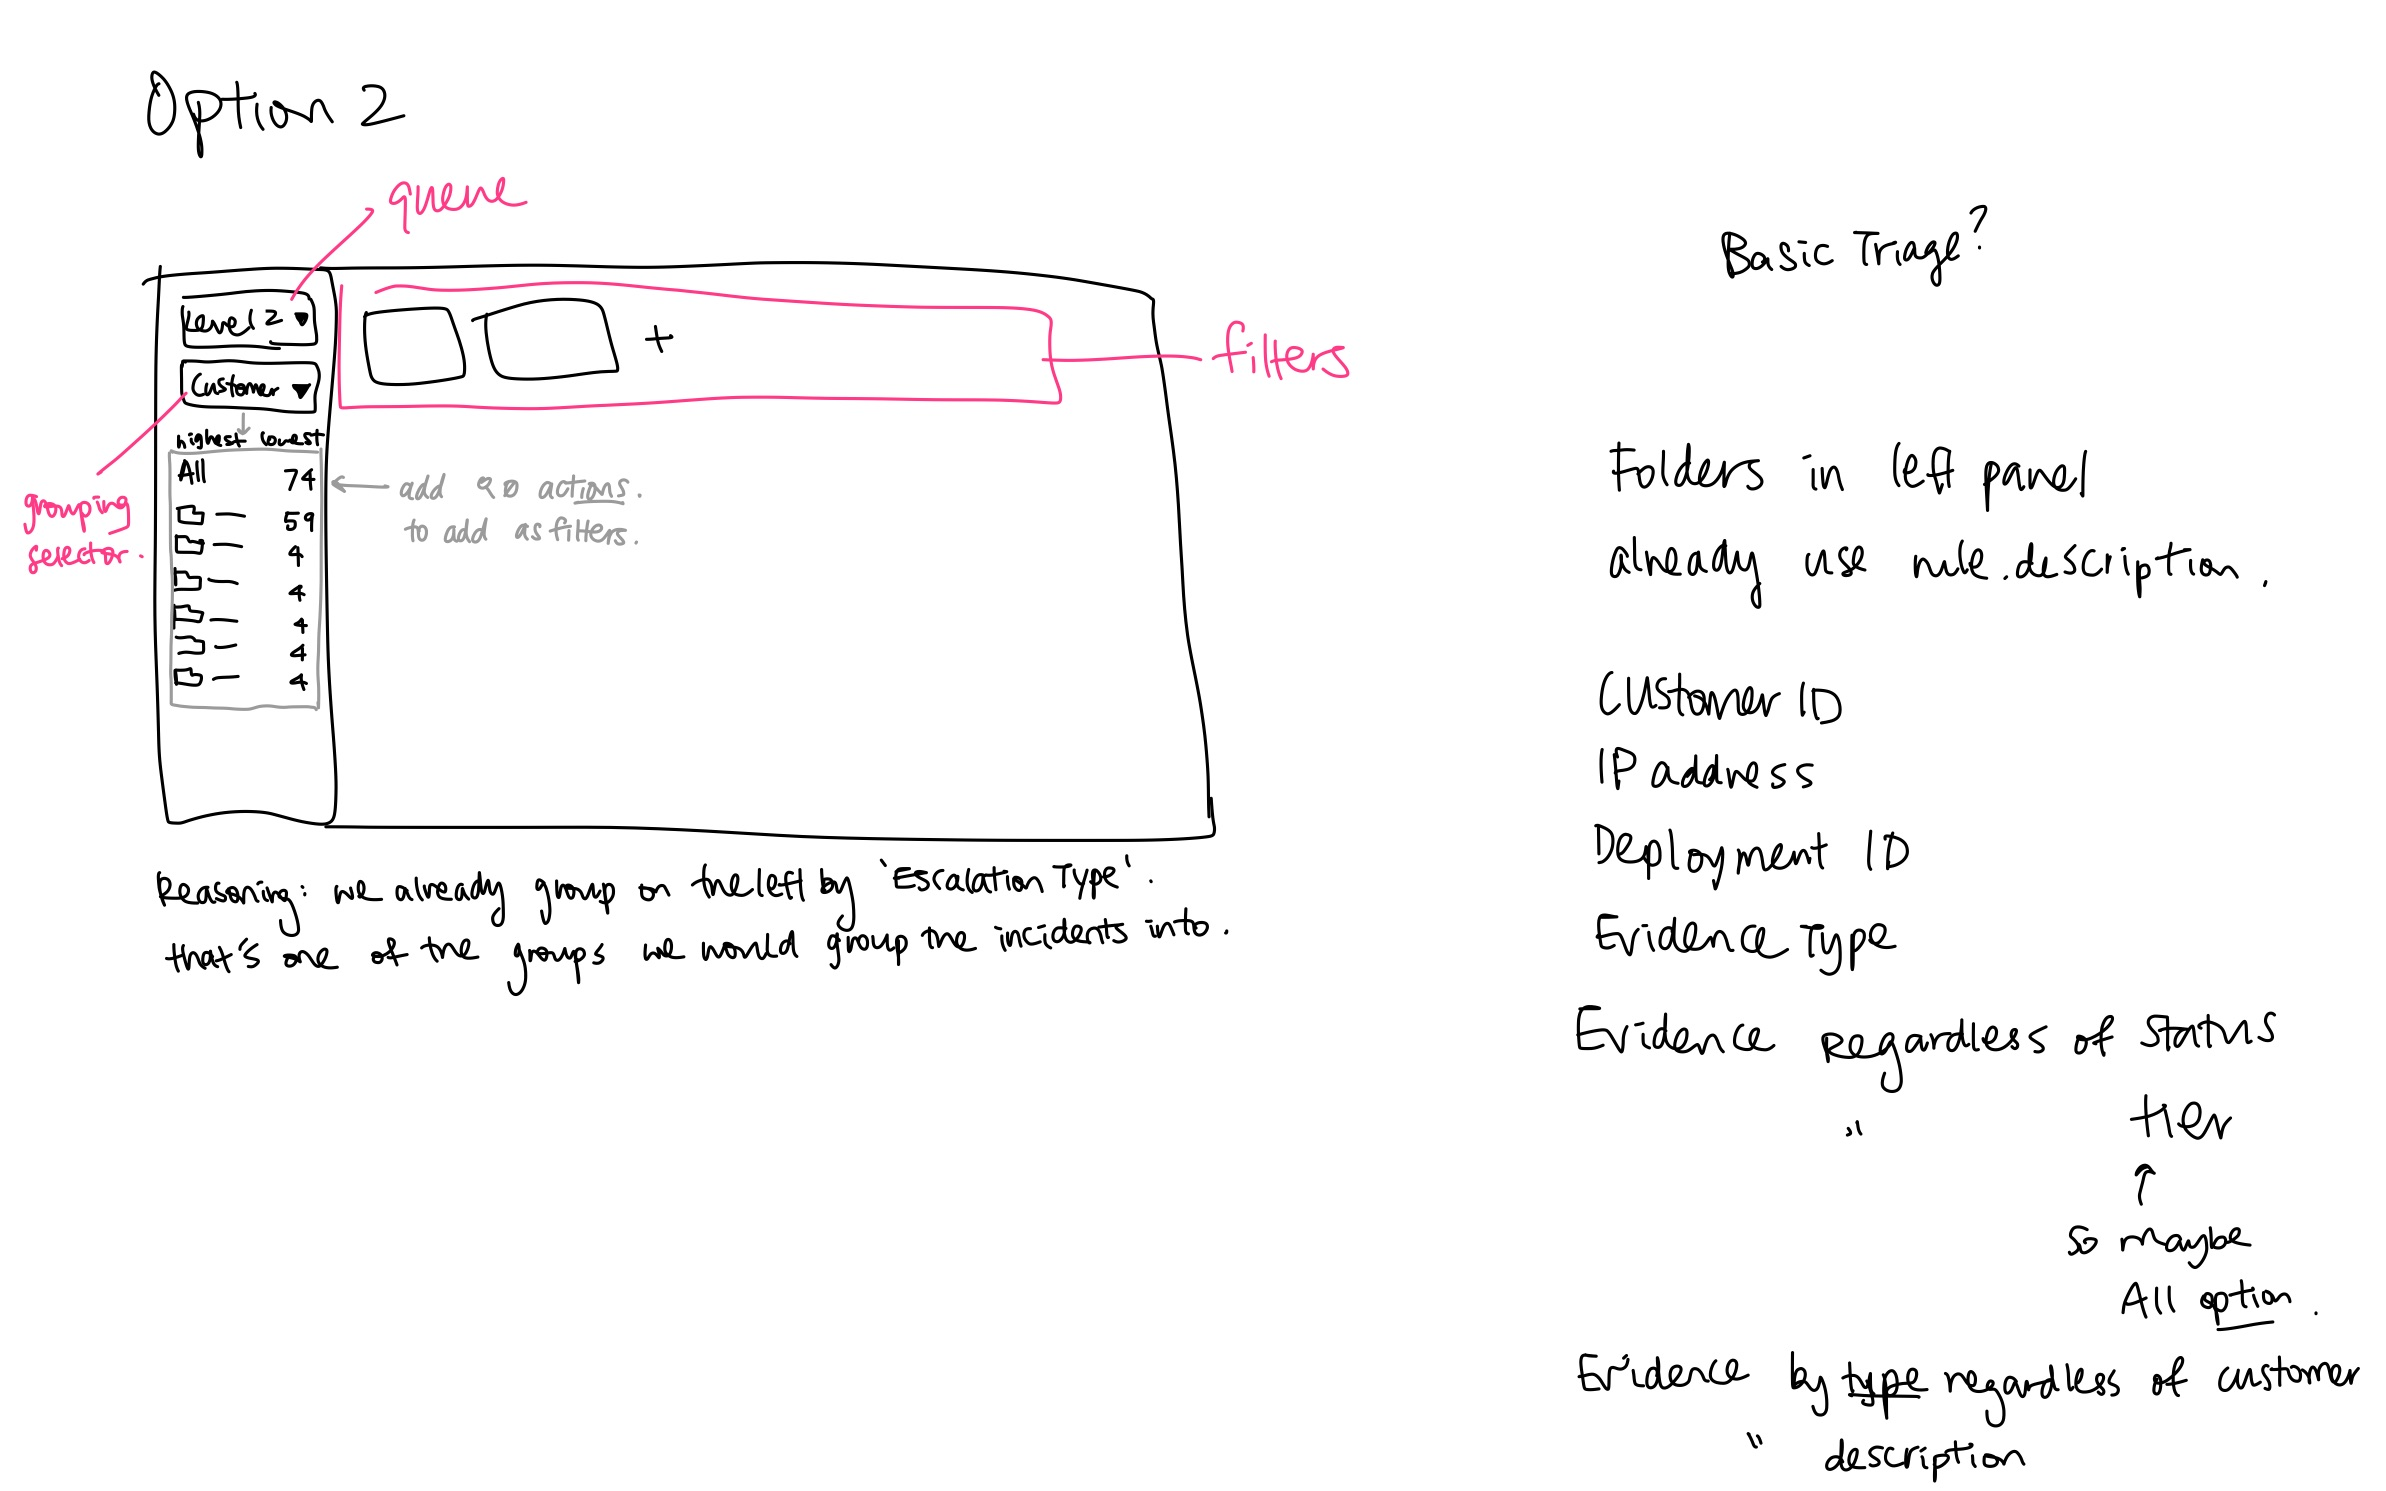
The filters live in a linear layout at the top, with color indicators for which attributes filter to include the attribute and which ones exclude the attribute. Along with the filters at the top and a queue selection for broader groupings of incidents, the final design of the dashboard supports pivoting and filtering tasks that TSE's carry out throughout their workflow.
The Triage UI significantly improved the productivity of Level 2 and Level 3 TSEs and bridged the gap between different user tiers:
Lessons Learned:
This project reinforced the importance of collaboration and research-driven design in complex workflows. By addressing specific user pain points and validating solutions through iterative feedback, we delivered a tool that TSEs seamlessly adopted, enhancing their productivity and satisfaction.